

Let’s take a look at the kind of chances that Bundesliga sides are creating this season.
The types are:
- Situation (open-play, corner, direct free-kick etc)
- Open play (six-yard box, outside penalty area etc)
- Game state (scores level, trailing by one goal etc)
- Timing (0-15 mins, 15-30 mins etc)
As most readers will no doubt already be well aware, expected goals (xG) metrics assess the quality of a chance by comparing it to large numbers of similar previous goal-scoring opportunities.
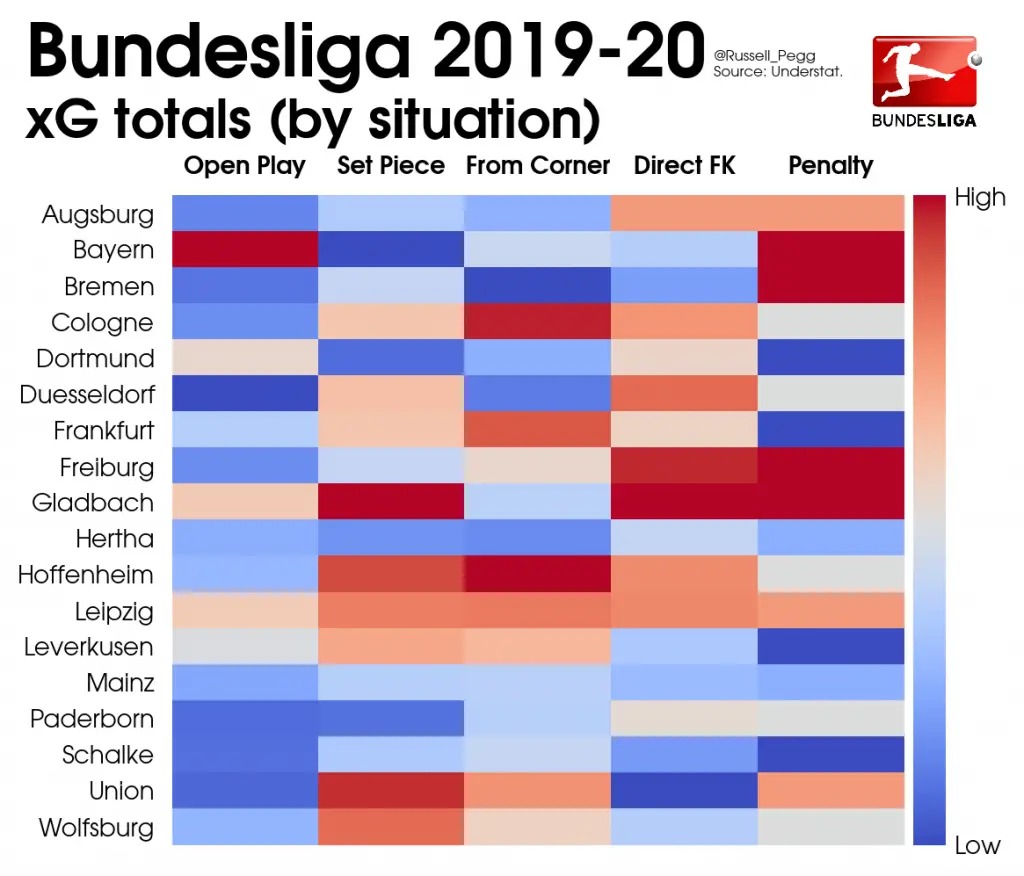
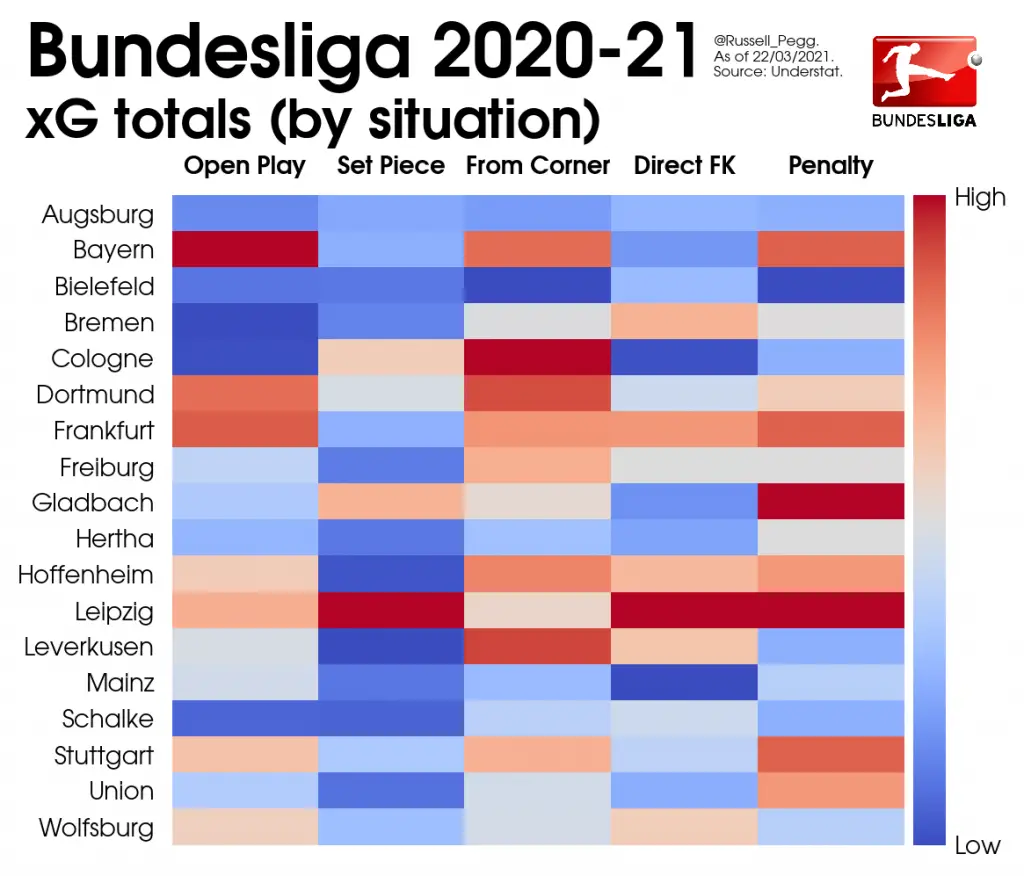
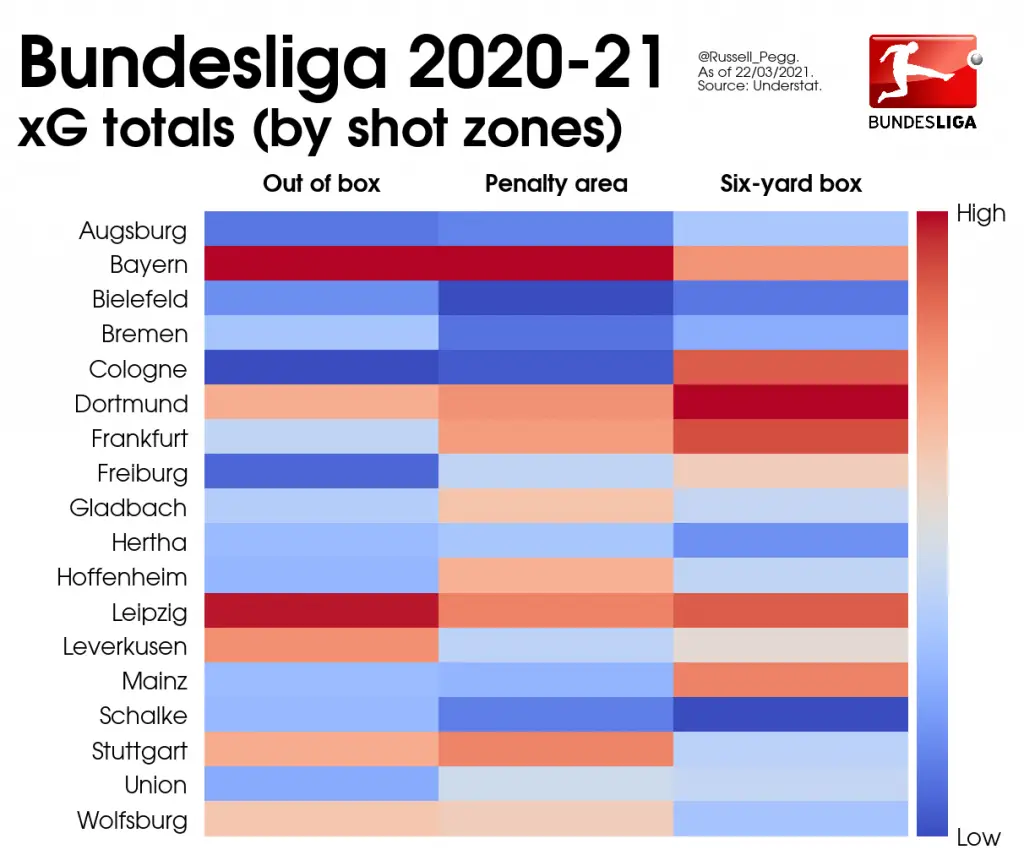
The “xG totals” heat-maps used here show us the sum xG of each type of chance created by a side.
Red indicates a high total compared to the other teams, blue denotes a low number.
These convey areas of relative strengths and weaknesses of teams in terms of chance creation.
So if we look at the situation xG totals below for the 2019-20 season, for example, we can see that:
- Bayern created an incredibly high amount of xG from open play, but they generated very little from set pieces.
- Conversely, Union created a large amount of xG for the league from set pieces, but they produced very little from open play.
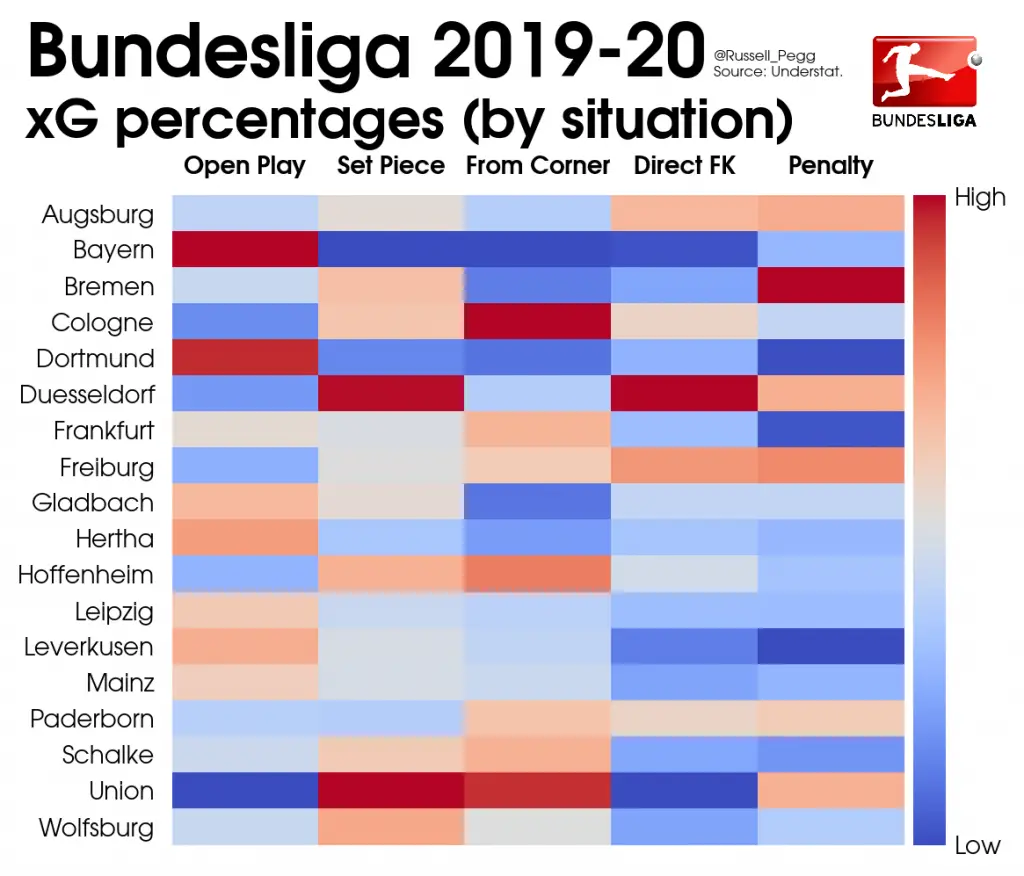
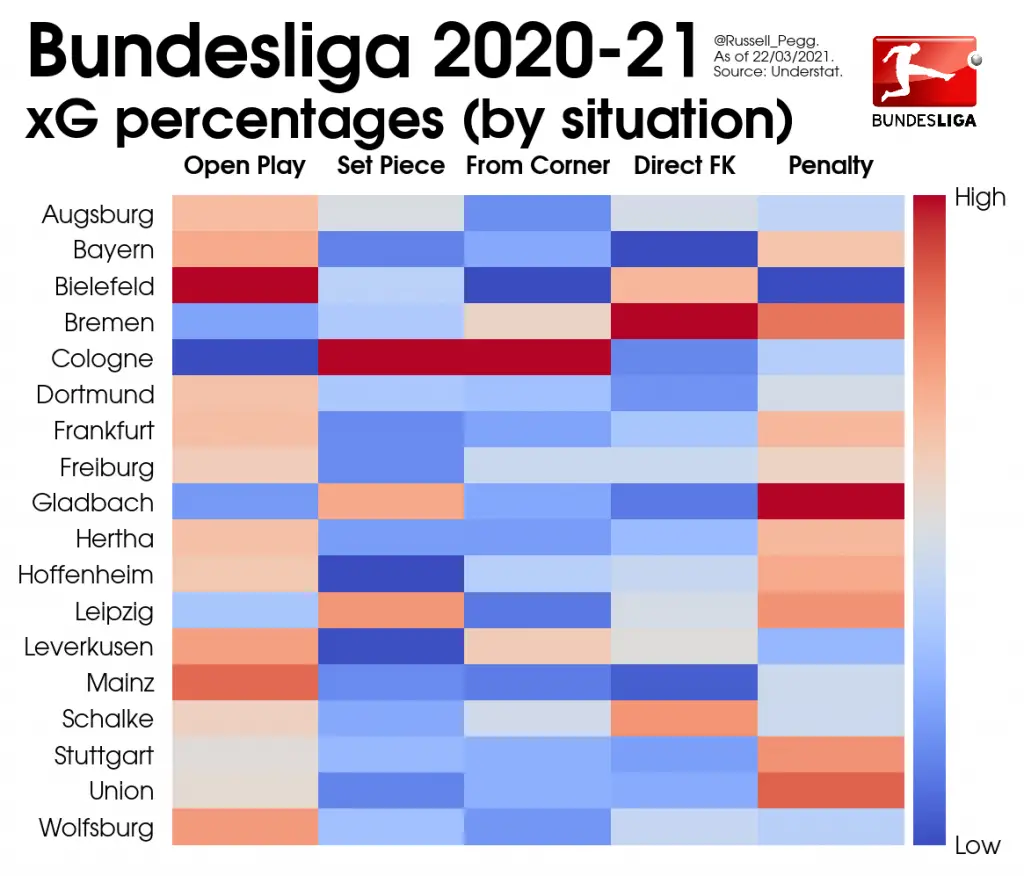
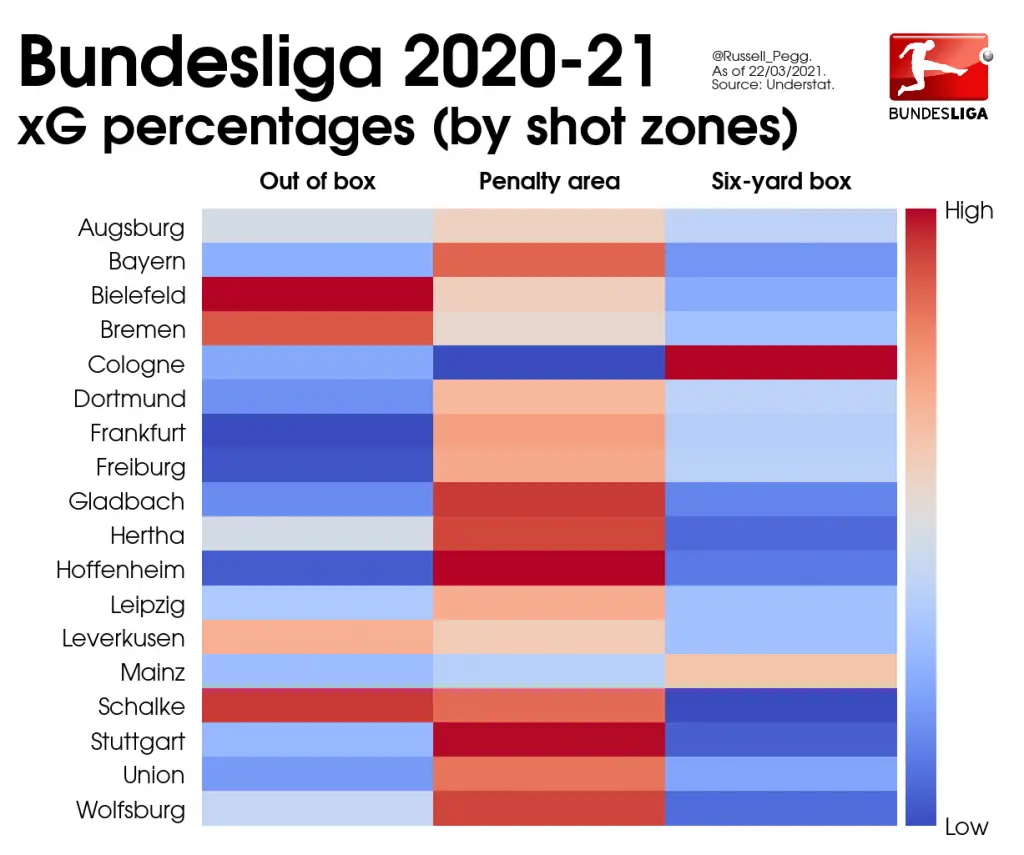
The “xG percentages” heat-maps show us the proportion of a team’s overall xG generated for each stat. Again, red indicates a high proportion and blue means a low percentage.
These depict what types of chances teams rely upon generally, which can differ markedly from a side’s xG totals. That in turn allows us to assess the (in)efficiencies of a team’s approach.
For example, if we look at the situation xG percentages heat-maps below for the same 2019-20 season, we can see that:
- Dortmund generated an extremely high proportion of their overall xG from open play, even though the xG totals heatmap above shows that Dortmund didn’t actually produce a very high total xG from open play. So that may well have been an area of inefficiency for BVB.
- Similarly, Dusseldorf created a very high proportion of their overall xG from set pieces, even though the totals heatmap above shows that Dusseldorf didn’t produce a particularly high total xG from set pieces. Again, that looks like an area of inefficiency.
- Conversely, Gladbach generated a low proportion of their overall xG from set pieces, even though the totals heatmap above shows us that Gladbach produced a league-high total xG from set pieces. That’s a sign of high efficiency in this kind of chance creation.
- There are of course instances when the two metrics do tally: for example, Cologne produced both a very high total xG and a very high proportion of their xG from corners.
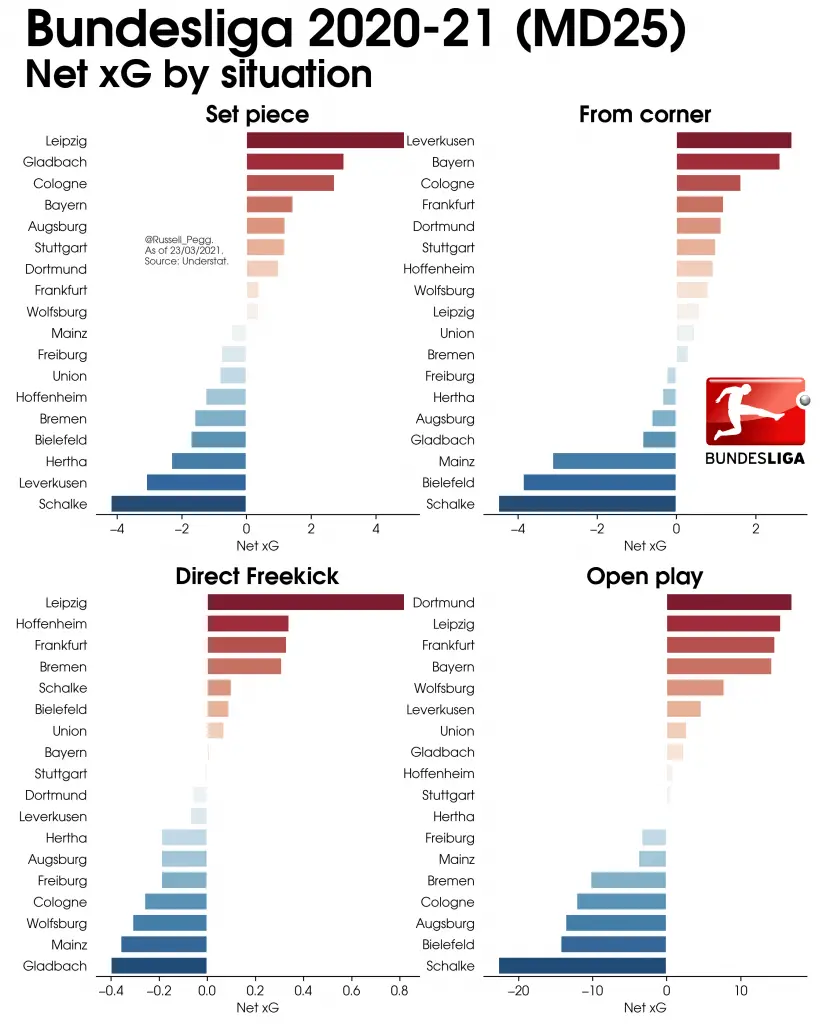
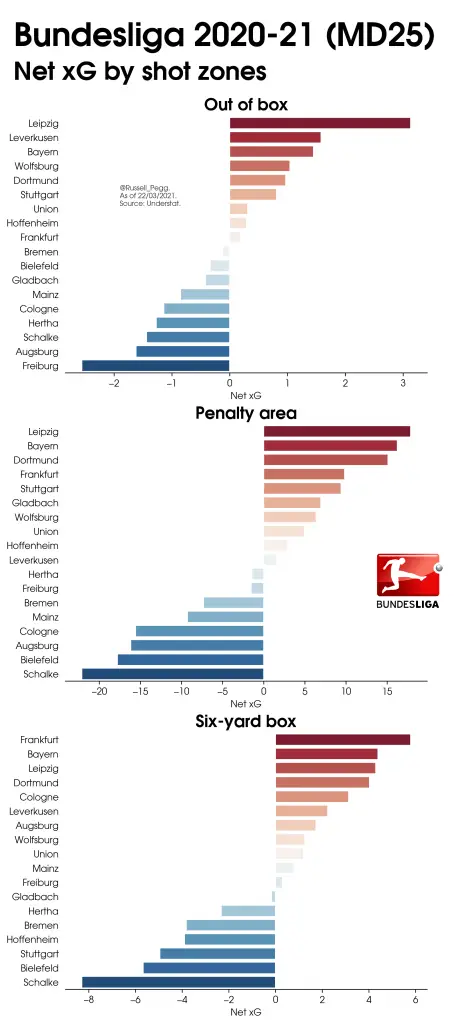
Finally, the “net xG” charts show whether teams are posting a positive or negative overall xG for each type of chance.
While the xG totals heatmaps only assess teams’ chance creation, these net xG graphs reflect both a side’s chance prevention and chance creation.
Situations
Moving on to the current Bundesliga campaign, we’ll start with shot situations.
Some obvious takeaways:
Remember Marco Rose’s freewheeling, buccaneering Gladbach side from last season? Well, that’s a thing of the past. They’ve barely outperformed their opponents in open-play xG this term, and a league-high 17 percent of their xG has come from penalties.
And remember Markus Gisdol’s freewheeling, buccaneering Hoffenheim side from a few years back? That’s also a dim and distant memory. No other Bundesliga side creates a lower proportion of their xG from open play than Gisdol’s Cologne team, which is also glaringly reliant on corners for producing chances.
Only Sampdoria and Burnley create a greater percentage of their xG from corners in the big five European leagues. For obvious reasons, that doesn’t tend to be a sign of a team that’s good to watch.
- Bielefeld don’t create much, but at least much of what they do create comes from open play, though their numbers are skewed a little due to them being the only side in the big five leagues yet to be awarded a penalty this season.
- While it’s a surprise not to see Bayern at the top of the net open-play xG rankings, they, Frankfurt, Dortmund and Leipzig are still streets ahead of the rest of the league.
- The reputation that Oliver Glasner’s Wolfsburg team have for being grimly effective may be a little unfair.
- Leipzig are the Buli’s undisputed free-kick specialists.
Timing
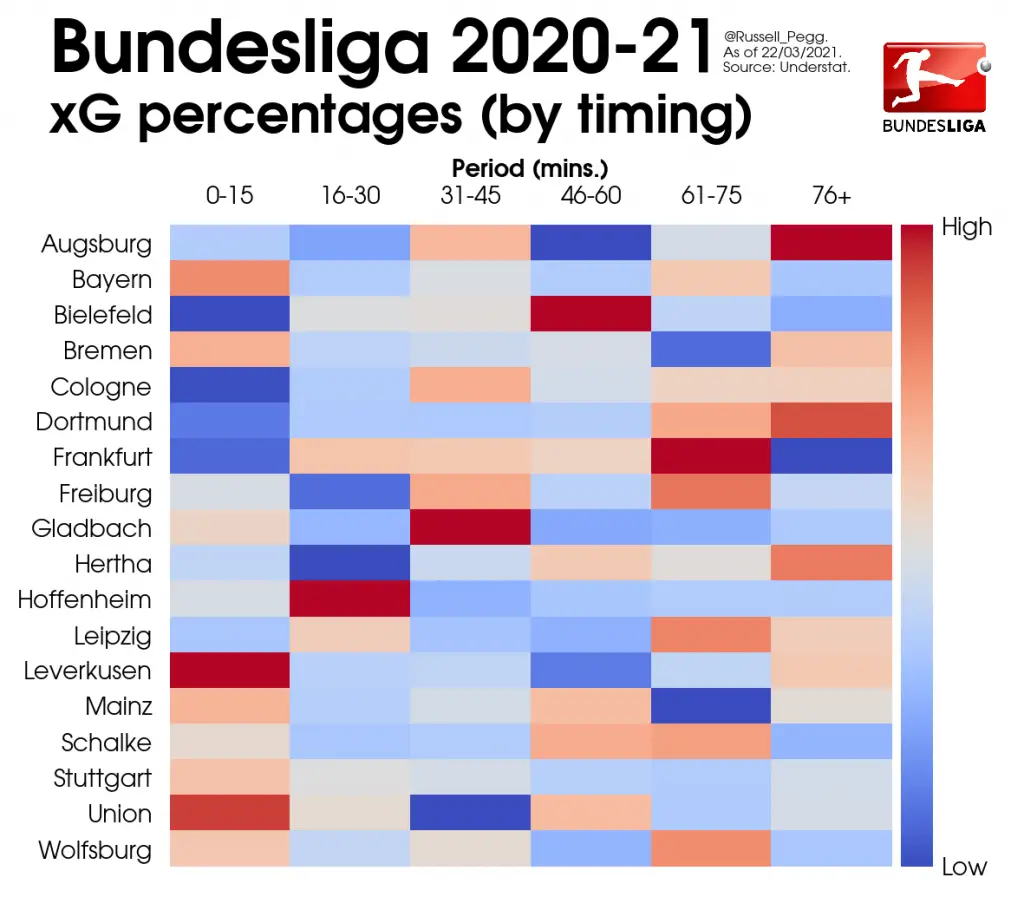
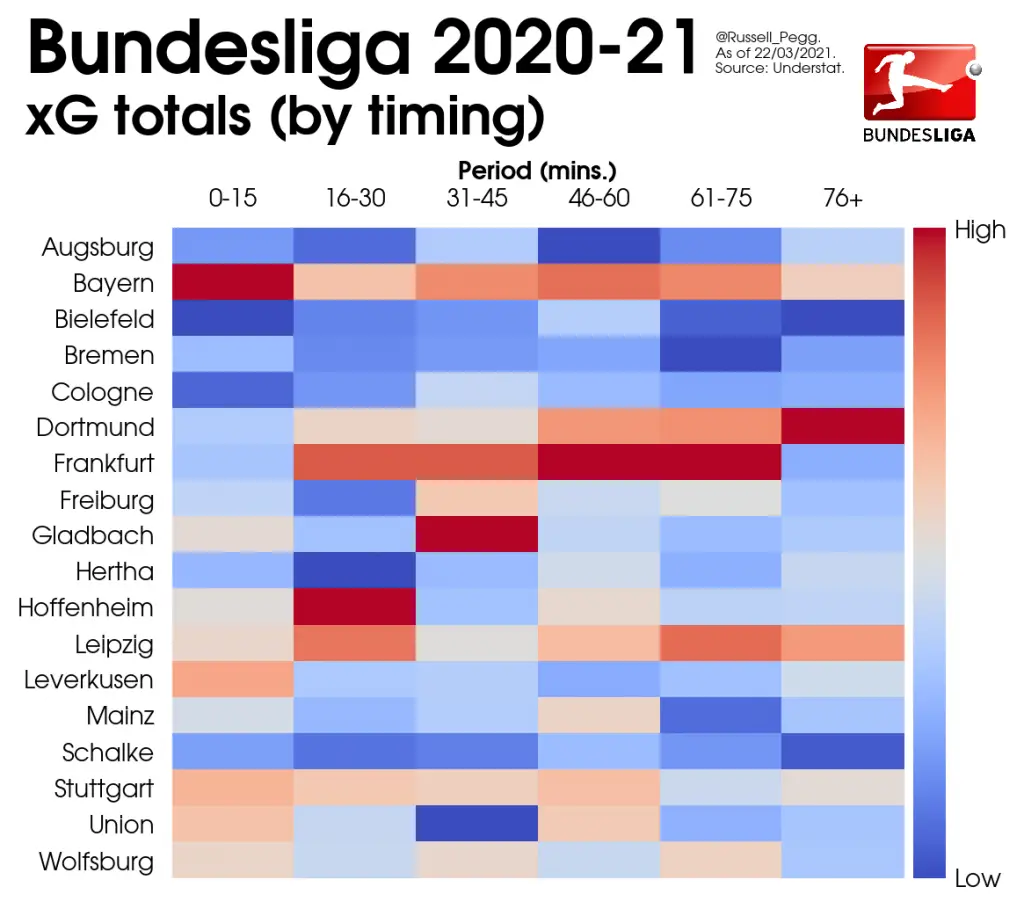
- Bayern begin both halves like a freight train.
- Union tend to start well and then fade.
- Schalke start badly and then fade.
- Dortmund are a real slow-burn of a team that often doesn’t hit its stride until the second half of the second-half.
- The half-time team talks of Peter Bosz (who’s been sacked since this chart was created) and Markus Gisdol don’t seem to be very effective.
- Augsburg have done a lot with very little.
- Frankfurt start and end matches poorly but are fearsome in between.
- Gladbach come alive just before half-time. And then go back to sleep.
Game state
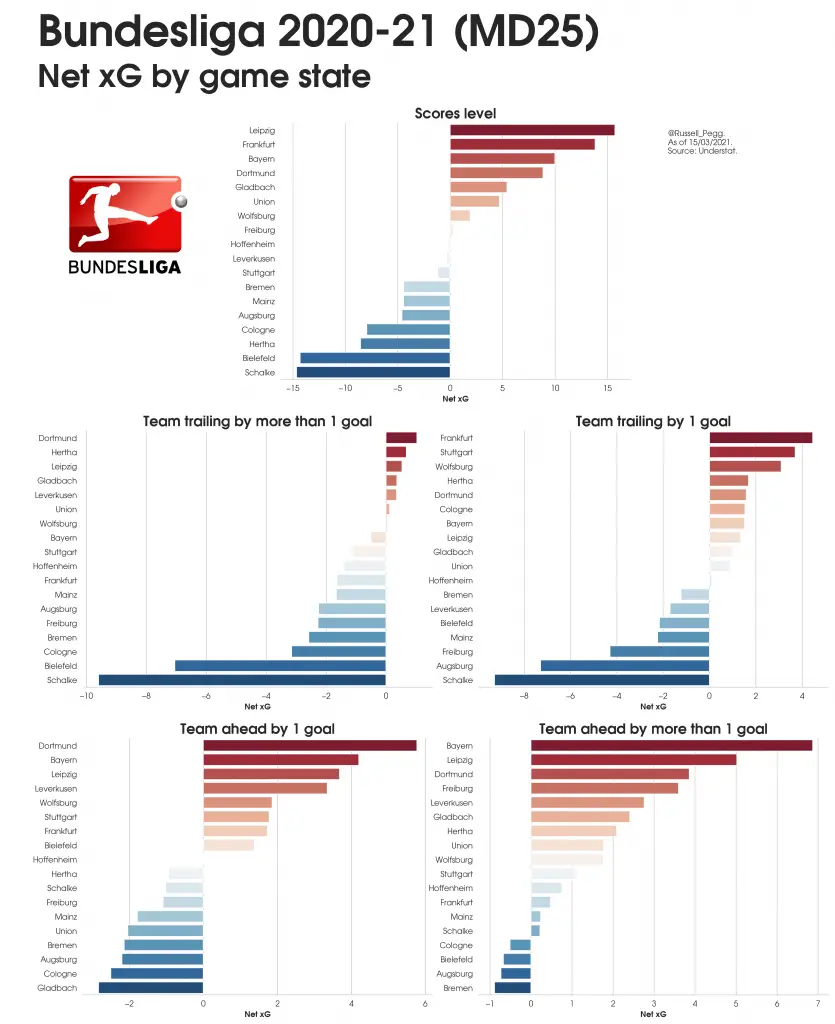
- Hertha don’t seem to start playing until they go behind.
- Gladbach are at their most vulnerable when they go a goal up.
- Bremen and Cologne are not good at protecting leads.
- Schalke are considerably less bad when they’re ahead – but they’ve only led for 142 of the 2,250 Bundesliga minutes they’ve played this season.
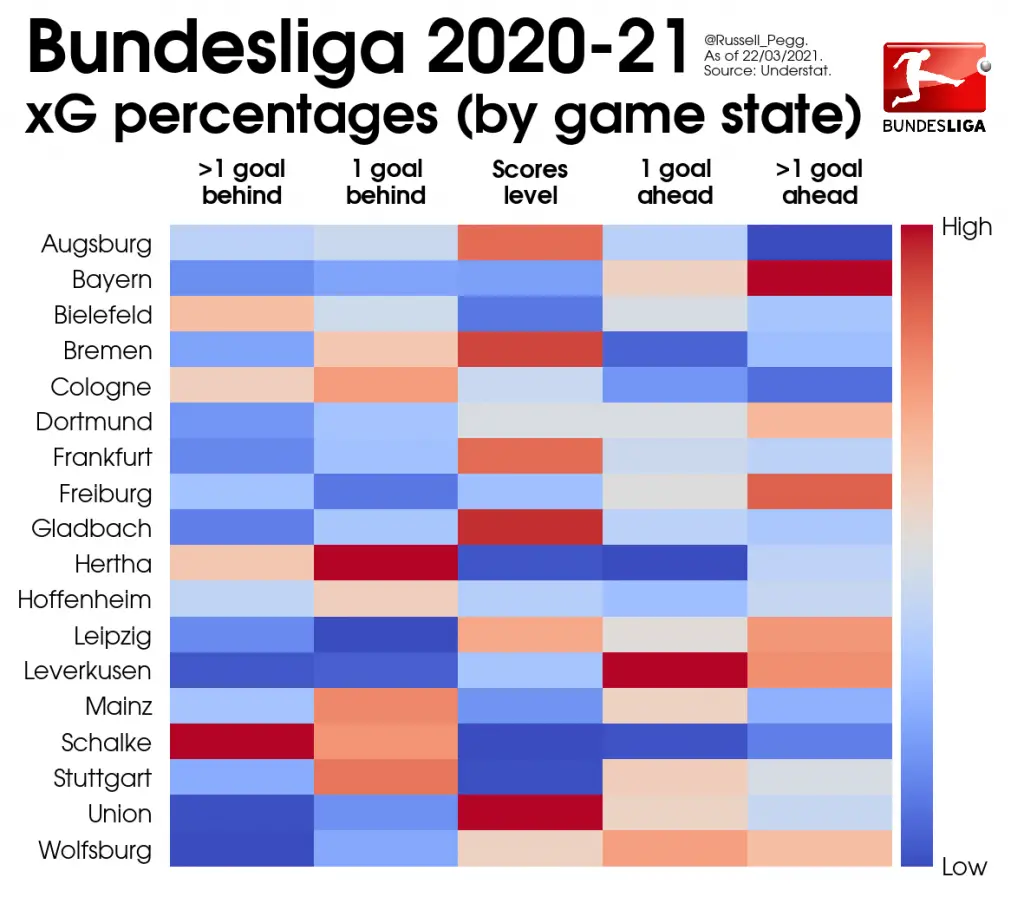
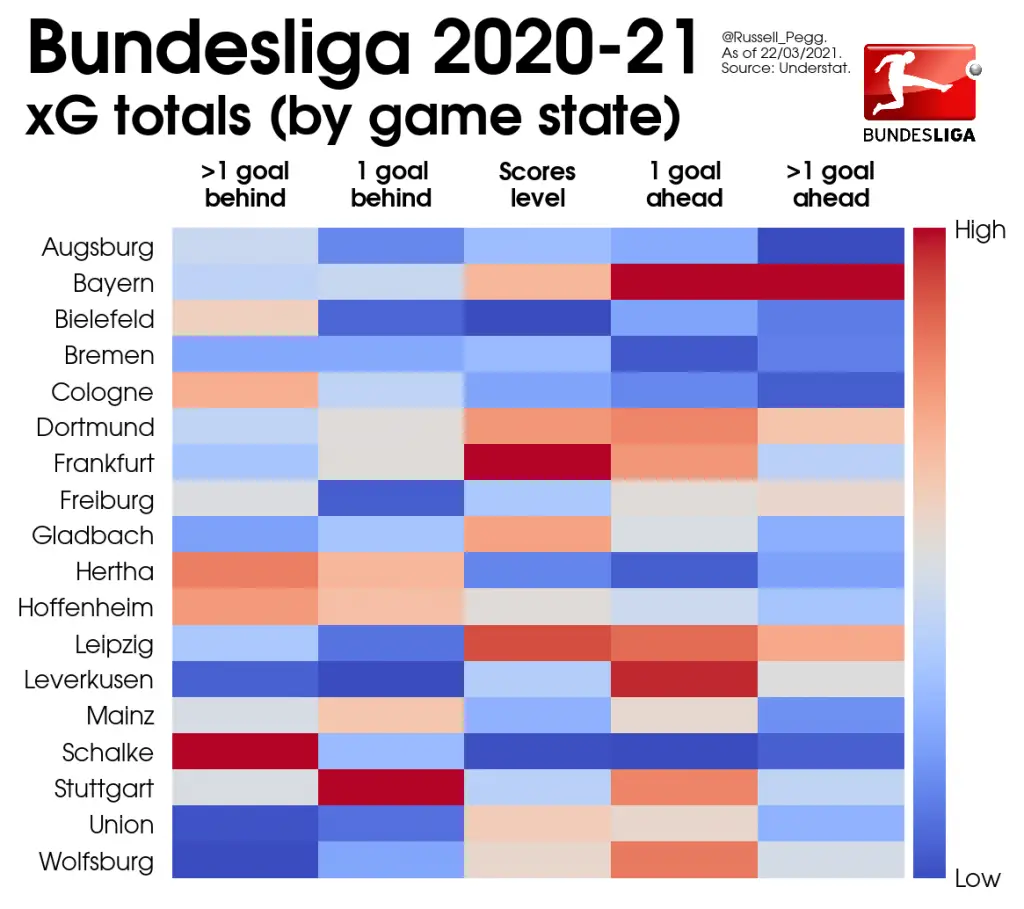
- Hertha definitely don’t start playing until they go a goal down.
- Bremen definitely seem to stop playing when they go a goal ahead.
- Scoring the first goal is more crucial for Leverkusen than any other Bundesliga side.
- Stuttgart are the Buli’s comeback kings.
- Comebacks are nigh on impossible once Bayern have taken the lead.
- Frankfurt seem to be perfecting the art of doing just enough to get a result.
Shot zones
By Warren Pegg.